
Project Members: Austin Veselka & Yasin Alam
Project Sponsor: Dr. Ke Zhang
The development of bioinformatics methods for understanding the process by which early stage single cells develop is currently underdeveloped. Although there have recently been major breakthroughs in generating massive amounts of data for single cells, the tools to understand the
data are few. In this update, we demonstrate the methods as well as preliminary plots and informatics for the ligand-receptor (LR) pairs for cells in the heart.
Data
The preliminary task is to visualize the dataset in a meaningful way that preserves the relationship between the LR pairs and the cluster they are part of. The data consists of numerous LR pairs that have either a ligand, receptor, or both expressed in one of ten clusters (Table 1). Note that the data is unconventional in that it does not fall into feature columns per row. There is a relationship between which LR pairs are present in each cluster and to other clusters, as well as other pairs. Searching for how to represent this has been our initial challenge as most visualization techniques are geared towards the traditional features/label style data found in machine learning tasks or otherwise numeric data. We have generated many representations, all with different goals in mind.
| Ligand | Receptor | C 0 | C 1 | C 2 | C 3 | C 4 | C 5 | C 6 | C 7 | C 8 | C 9 |
| ADAM15 | ITGA9 | ADAM15 | ITGA9 | ITGA9 | ITGA9 | ITGA9 | Both | ITGA9 | |||
| ADAM15 | ITGB3 | ||||||||||
| ADM | CALCRL | ADM | ADM | ADM | CALCRL | ||||||
| ADM | RAMP2 | ADM | ADM | ADM | RAMP2 | RAMP2 | RAMP2 |
Data Visualizations
Below we have 3 ways to represent the data. Figure 1 is a heat map showing the similarities between clusters based on ligands or receptors. Figure 2 is a three dimensional representation of the dataset where the axis represents cluster, ligand, and receptor. Figure 3 illustrates the most successful visualization. Each color represents a different cluster. Each node is a LR pair. Connections are drawn based on when a component of a LR pair is found in another cluster. The more connections present, the bigger the node. Connections also act as springs bringing nodes together when connected, this way, there is some spatial significance to the graph. Clusters that communicate often will be closer to each other in space.

Figure 1: Heat map of clusters 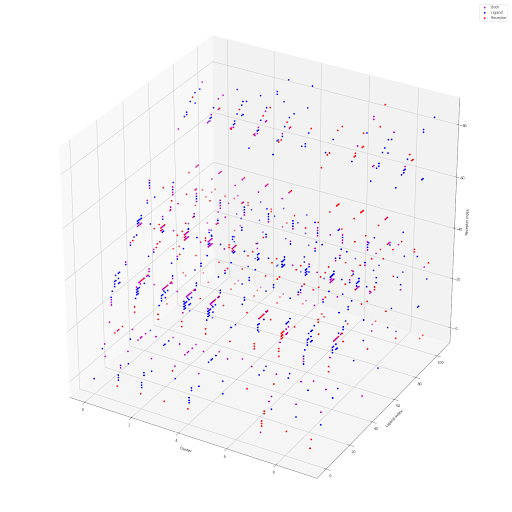
Figure 2: 3D representation of data 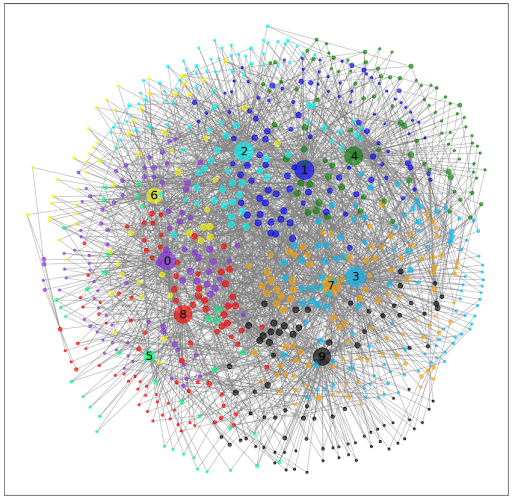
Figure 3: A graph representation of the communication between different cell types
Challenges
We are still looking for potential better representation of the information, this evolves every time we meet with Dr. Zhang and discuss the results and interpretations stemming from the last idea. We are also concerned about the viability of the visualization methods above when scaled up. We will continue to improve until we have a finished and scalable method to apply to the Texas A&M University expanded dataset. The next objective is to obtain meaningful statistics from the data and visualizations.
Future Goals
The goals of the project include 1) Dynamically modeling and understanding the interactions between different cell types at different stages of their development and 2) creating a comprehensive framework to work with and obtain information for single cell genome sequencing.
Recent Comments