
The program our group is attempting to make will take high resolution electron microscopy images and calculate and display multiple physical characteristics such as intensity and strain data. The program will have a GUI compatible with Linux systems and allow the user to determine what actions to take. New features include a new library function for the diffraction pattern, heatmap scaling, and overall fixes. The team is also taking steps to possibly introduce machine learning functionality in the future.
Background
Electron Microscopy is the process of taking detailed pictures of microstructures using an electron beam as a source of illumination. Due to the shorter wavelength of the beam, the images produced allows for greater detail of microstructures. Using this technique on materials allows material scientists to determine the structural uses of said material. The specific microstructures that will be analyzed in these diffraction patterns is the lattice structure, or the arrangement of atoms in the structure. The actual image shown is a close inspection of the material and requires the program to analyze the pixels in order to properly witness the diffraction pattern. Since the images taken vary in size, the amount of diffraction patterns a single image can contain can range in the tens of thousands. Thus, the need for a program that can analyze each pattern and calculate the data.
Current Progress
New features involve creating a library of diffraction patterns based on a user input. The user picks two coordinates that act as the upper left and lower right vertices of an area and the program outputs a window that displays the diffraction patterns within the area. The user can flip through a selection of diffraction patterns with the coordinates being displayed on the top of the pattern to let the user know which specific pattern they are looking at.
Another feature allows a single diffraction pattern to be picked using the mouse on a heatmap outputted by the program. Previously we were having issues getting the mouse tracking to work properly but have managed to get this to work. This works especially well when we do not want the program to take the time to calculate a full library. It is important to note that a heatmap must first be outputted in order to utilize this function.
Another new feature that has been added is having the ability to scale the heatmap in closer to get a better visual representation of an area on the heatmap. Zooming in allows the user to get a better sense of the value of the pixel. This is done by taking an existing heat map and clicking and dragging so that an area is highlighted. Once the desired area is highlighted, the user releases and the program will auto adjust to the area’s size. Currently, the function only allows the user to zoom in and not out back to the original heatmap size. The user needs to recalculate the original heatmap if they want to get back to the original.
Other minor changes involve adjustment to how the data is calculated. The array data makes sure to take out any outliers that might have been calculated. This is done by taking the lower and higher quartiles and subtracting each value by the difference of the two multiplied by 1.5. The resulting values are the minimum and maximum of the data so nothing smaller or larger within that range will be outputted. Other considerations involve how the center point of each diffraction patter is calculated. Originally, the peak with the highest intensity was labeled as the center. However, it was noticed that through each pattern, that spot can sometimes change. We are currently still investigating the best way to determine the center point of a given pattern. Ultimately, this discovery leads us to believe there are alternatives to the Pixstem library, the main coding library that we have been using throughout development.
Figures
Below are included figures for some of the features that were mentioned. The library function is demonstrated as well as the current GUI design.
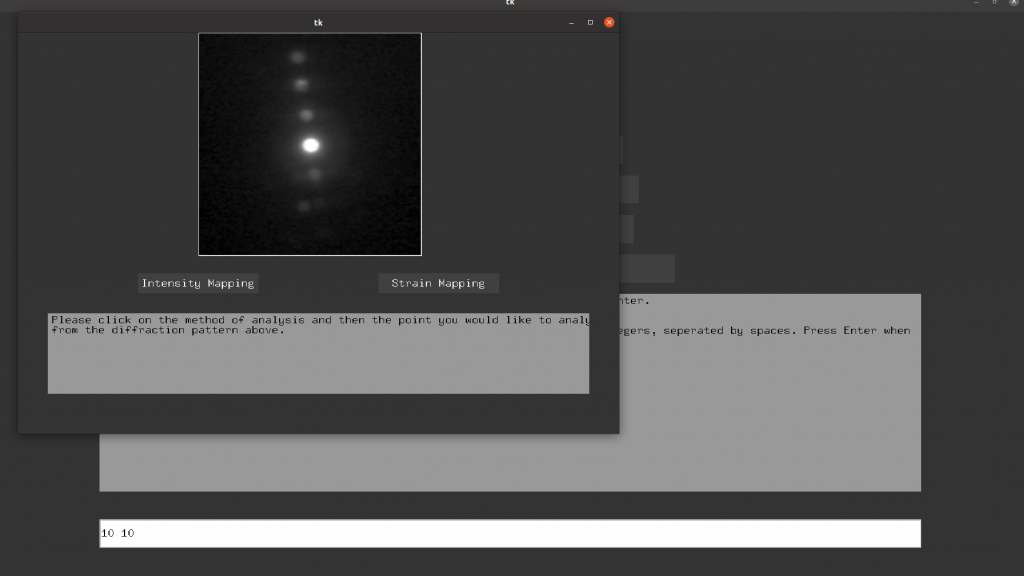
Fig. 1: Current GUI Design 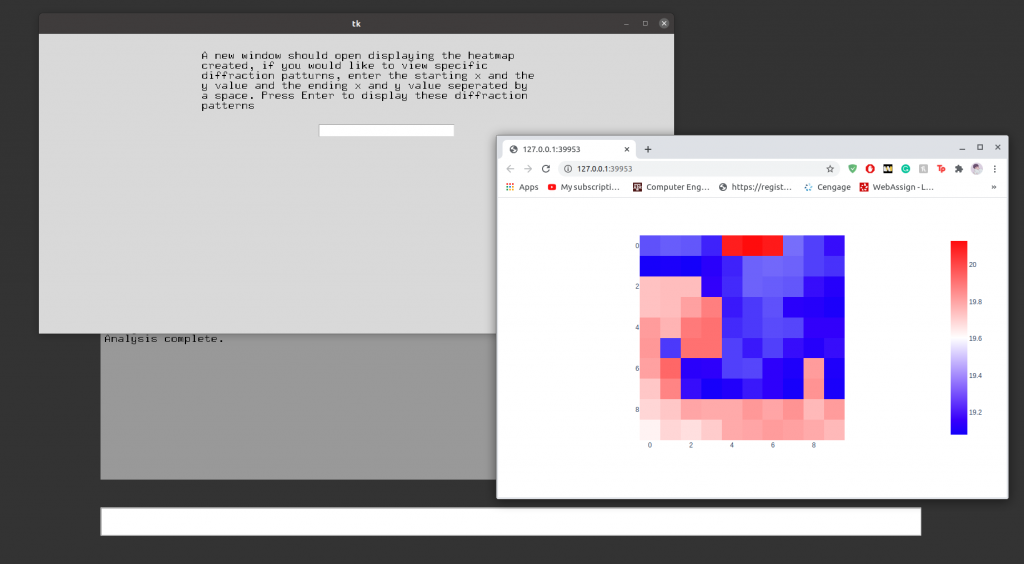
Fig. 2: Library Range Selection 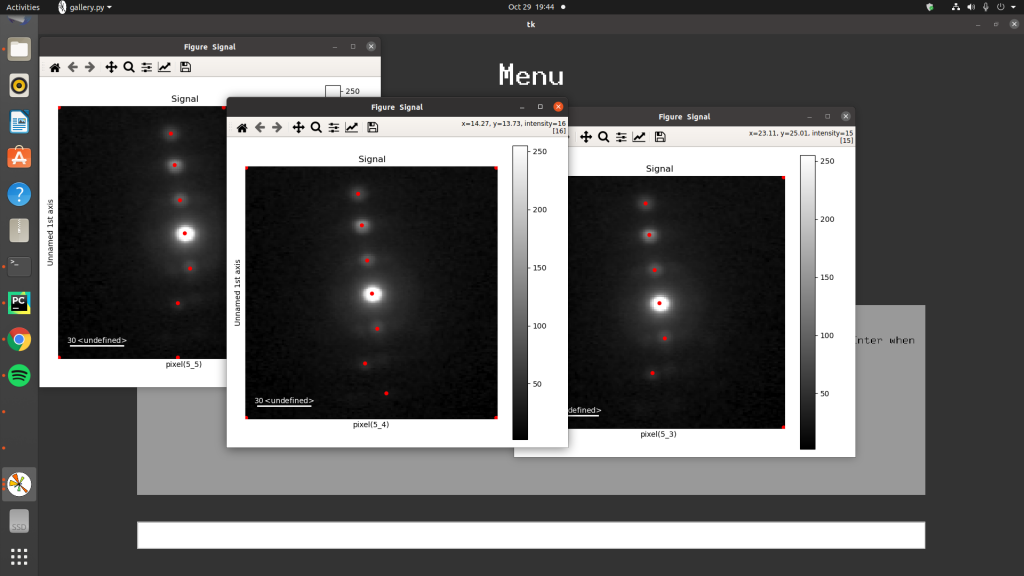
Fig. 3: Library Output
Future Plans
Since we are looking at possibly replacing Pixstem with something else, it is possible that we are looking at machine learning methods of dealing with finding the exact position of the peaks and working from there. We are not attempting to make our own model but use a pretrained deep neural network or the like to find the shapes. Currently, we are looking at trained models on GitHub and other sites to do this, but there hasn’t been much progress in that area. Another potential direction we may go is using an algorithm to determine the shapes. This does not utilize machine learning, but instead hard codes the solution into the program.
Right now, we are in the deep in the middle of development. We still have more of the project to work on, but right now we have a solid program and foundation. The group has a clear idea of where the project is going and how to progress.
Recent Comments